Videoguides
Get help with most common tasks in Xact
Some things are easier when you see them with your own eyes. We regularly create and update our library of video guides covering all the most commonly used functions in Xact.
See how to create surveys, find help with activations, and get to grips with user management. And much, much more.
SurveyXact Videoguides
1. User management
In this video we guide you through user management and user roles in SurveyXact. We provide an overview of the “User” tab and show you how to assign different privileges in the organization, as well as how to assign access to multiple surveys at once.2. Get started with your first survey
As the title indicates, this video helps you to get started with your first survey. Here you get an overview of the three tabs of the SurveyXact – Questionnaire, Data collection and Analysis, and how to create a survey and grant others access to surveys.3. Creating a questionnaire
This video guides you through the creation of the questionnaire itself and shows a number of features and options that are available in SurveyXact – including question types and validation rules.4. Background questionnaire
In this video we show how to create questions for the background questionnaire in SurveyXact. The questions you create in the background questionnaire may have a significant impact on the subsequent analysis of the collected answers in a survey.5. Activations
In this video, you can get help with how to use the “activations” feature in SurveyXact, provide paths in the questionnaire by hiding/displaying certain questions for specific respondents, and send respondents answering the same questionnaire in different directions depending on the answers given.Tip: Activations can also be created based on data that is imported in the background questionnaire
6. Self-creation
Self-creation is used if you do not already have your respondent’s information, such as e-mail, telephone number or address. Here they register themselves when they answer the questionnaire. This video shows how to enable self-creation in data collection.7. Creating respondents
In this video, we show how respondents are created under the “Data Collection” tab, for example, if the self-creation link is not used. You get a brief overview of the different distribution channels, and a review of importing respondents via a csv file. By importing your respondents, you can choose exactly what background information you want to have about your respondents in advance. This information is created as a question in the background questionnaire prior to import.8. E-mail distribution of questionnaires
In this video we review the distribution of questionnaires. You get an overview of the different e-mail templates and how to select the respondents to whom the questionnaire should be sent. In addition, the questionnaire distribution can be set up to run automatically via a schedule – we demonstrate this at the end of this video.9. Anonymize personal data
This video helps you to delete personal data from your survey using the “Anonymize” feature in the data collection. This feature is particularly relevant to compliance with GDPR and is used, for example, in cases where a respondent may wish to have his or her data deleted after the survey has been completed. When using the anonymization feature, it is no longer possible to connect responses to specific respondents.
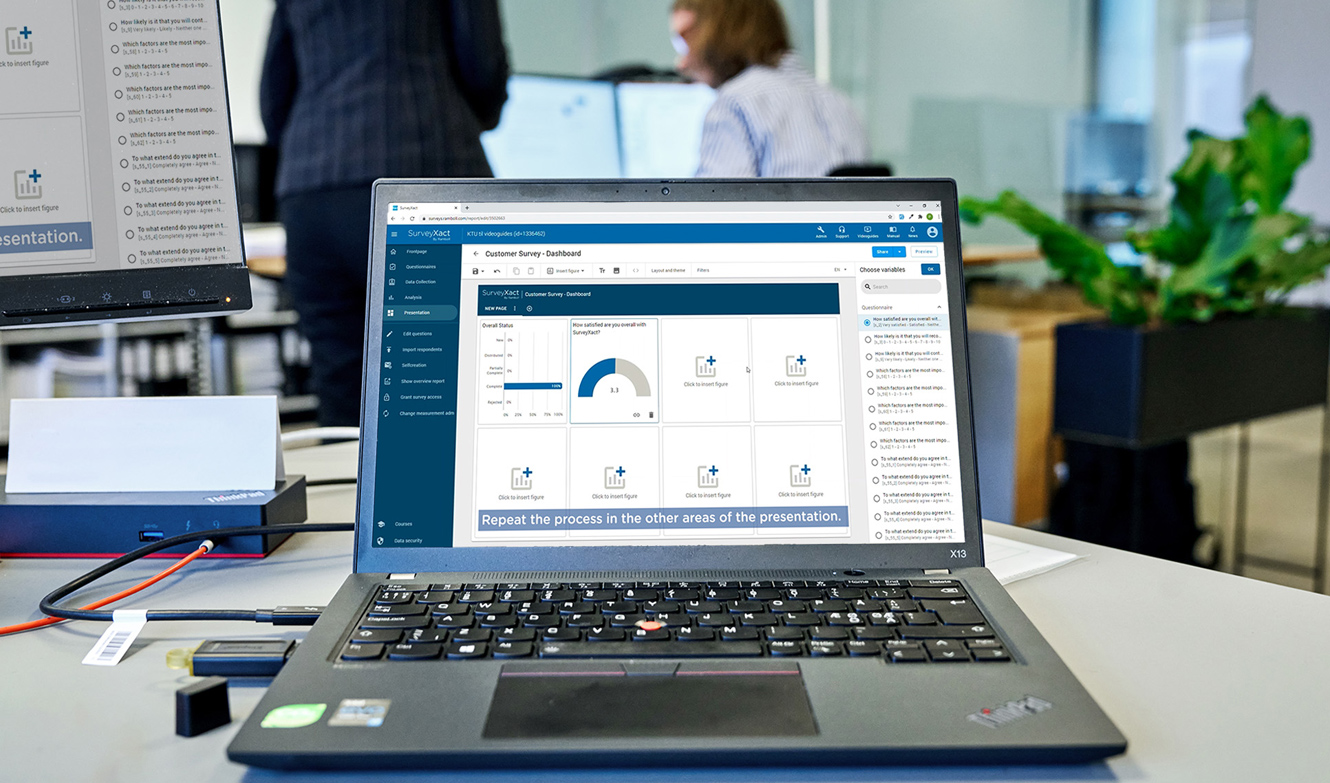
10. Introduction to dashboards.
Dashboards can help you present your data in an easy, simple and manageable fashion. This video introduces you to inserting figures and customizing the layout in your dashboard.
11. Work with filters and benchmarks.
In Dashboards you can work with filters and benchmarks. A filter gives you the opportunity to choose the exact data being shown. And, with benchmarks you can compare the results from to figure to other data.
12. Work with multiple pages
When working with dashboards you have the possibility to add multiple pages and links between these. This video demonstrates how to create and name pages as well as how to customize the view of the reader.
13. Sharing of a dashboard
This video demonstrates how to share your dashboard. You can share your dashboard with a few selected people, or you can create a public link accessible from a browser.
14. Introduction to reports
Reports can quickly and easily communicate your data. This video introduces you to how to insert figures and customize the layout of your report.
15. Work with overview reports
Overview reports can be used to show your survey at a glance. Here we show you how to create an overview report to communicate your data.
16. Work with filters and benchmarks
You can work with filters and benchmarks in reports. A filter allows you to determine exactly which data to display. And with benchmarks, you can compare the results of the figures with other data.
17. Work with sub reports
You can choose to make a sub-report based on your completed master report. In this video, we show you how to create a sub-report based, for example, on departments, products, managers, or similar.
18. Sharing and exporting reports
This video shows you how to share your report. You can share your report online and with selected persons or through a public link that can be accessed through a browser. You can, of course, also export your report in multiple different formats.